A series of interconnected translucent testing nodes arranged in a clean grid-like flow

Best No-Code Automation Testing Tools for Enterprise and Codeless Testing

About 63% of tech recruiters report difficulty finding experienced test automation engineers — a shortage that isn’t closing anytime soon. Product teams ship weekly. The old answer — hire a dedicated test engineer to build a Selenium or Playwright framework — is neither fast nor affordable for most teams. No-code automation testing tools exist to fill that gap. They let QA leads, product managers, and non-developers build and run automated tests through visual interfaces, plain English, or AI-powered recorders, without writing a single line of test script.

But “no-code” isn’t one thing. The label covers tools that work very differently — from simple recorders that break the moment a button moves, to AI-native platforms that adapt to UI changes on their own. In 2026, choosing the wrong tool costs more time than it saves.


What “No-Code” Actually Means in Test Automation?

Codeless test automation means building and running automated tests without writing code. Instead of scripting in Cypress or Selenium, testers define what they want to verify — through drag-and-drop flows, natural language steps, or browser recordings — and the tool handles the rest. For a broader look at how these tools compare across workflow automation categories, our low-code/no-code automation tools overview covers the landscape well.

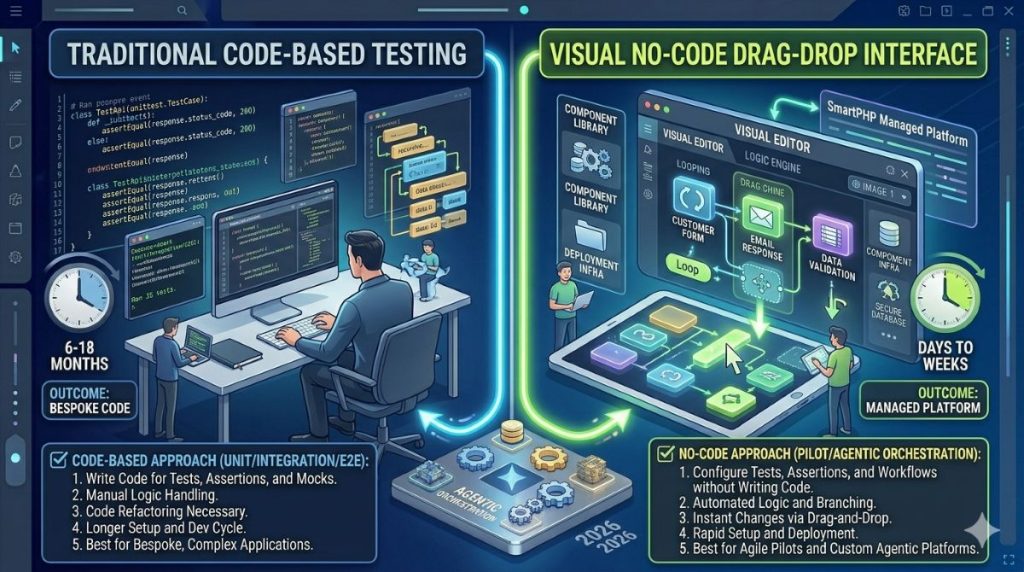
Comparison of code-based and no-code testing approaches on a split screen

The practical upside is access. Over 74% of businesses now rely on automated testing for at least half of their QA processes, but code-based frameworks locked out the non-engineers who needed them most. No-code testing tools change that equation.

One honest caveat first. Codeless tools reliably handle 80–90% of standard test scenarios. The remaining 10–20% — complex conditional logic, custom data transformations, non-standard auth flows — still tends to require code. That ceiling matters before you sign up for anything.

The other thing no-code doesn’t mean: consequence-free. You still own the test suite. Someone still needs to design test scenarios, review failures, and decide when coverage is adequate. The tool removes framework overhead, not accountability. That distinction changes how you evaluate every platform on this list.


The Four Mechanisms Behind No-Code Testing Tools

Not all no-code automation testing tools work the same way underneath. Four distinct authoring mechanisms have emerged in the market — and the mechanism a tool uses determines its stability, scalability, and long-term maintenance cost more than any feature checklist will, especially for teams comparing platforms with broader test automation services.
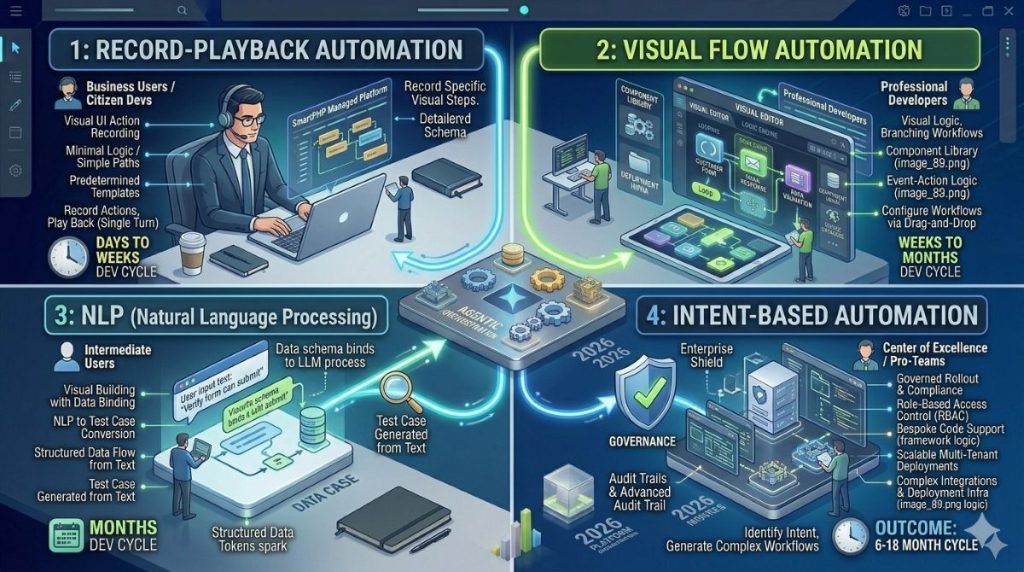
Four mechanisms of no-code test automation illustrated as quadrants

Mechanism 1: Record-and-Playback

You click through your app; the tool captures each action and converts it into a test replay. Ghost Inspector, Reflect, and BugBug (in its basic mode) work this way.

The strength is speed. Your first automated test can be running in under ten minutes. The weakness is brittleness — the recording captures the exact path you took. A developer restructures the DOM, moves a button, or renames a CSS class, and the test fails. High-change applications eat record-and-playback tests alive.

Mechanism 2: Visual Flow Builder

Instead of recording a path, you drag-and-drop nodes representing actions — click, fill, assert, wait — into a flow diagram. Leapwork is the clearest example. This is more durable than pure recording because the flow describes logic, not a specific captured interaction.

The tradeoff: complex test scenarios become a spaghetti diagram that nobody can read or maintain. This mechanism scales reasonably to a few dozen tests. Past that, the visual overhead becomes a management problem of its own.

Mechanism 3: Plain-English / NLP

You write test steps the same way you’d write instructions for a person: as sentences. “Go to the login page. Enter the email. Click Sign In. Verify the dashboard loads.” The AI interprets each sentence and maps it to browser actions at runtime. testRigor, Rainforest QA, and Virtuoso QA all use this approach.

The appeal is a genuine zero technical barrier. The catch is ambiguity. “Click submit” fails when two submit buttons exist. Debugging NLP test failures requires understanding what the AI interpreted, which is less transparent than reading a stack trace.

Mechanism 4: Intent-Based Authoring

Tests are written in a structured format — typically YAML — where each step has an explicit intent field. The AI resolves intent to browser actions at runtime, stores the resolved locators, and re-heals only when a locator fails. Shiplight AI and some Mabl modes use this approach.

It reads like English, structures like code, and version-controls in git. More durable than record-and-playback, more precise than pure NLP. The tradeoff is a minimal learning curve — less than any scripting language, but not quite as frictionless as clicking record.

Almost every modern no-code testing platform now includes AI-powered features — self-healing locators, autonomous test generation, failure analysis — regardless of its primary mechanism. The mechanism still sets the tool’s character, though.


Key Features to Evaluate Before Choosing a Tool

Feature marketing in the testing space is dense. What actually separates good platforms from mediocre ones comes down to five criteria.

Self-healing locators. When your UI changes, tests built on hard-coded CSS selectors break. Self-healing tools detect that an element has moved or changed and find it again using alternate strategies. Enterprises adopting self-healing automation report 25–50% reductions in maintenance overhead. This is not a luxury — it’s what determines whether your test suite is an asset or a liability six months after setup.

CI/CD integration. The difference between “running tests sometimes” and real automation is tests that execute automatically on every pull request. Confirm that the tool integrates natively with your specific pipeline — GitHub Actions, GitLab CI, Azure DevOps, Jenkins — before committing. API-based triggers work; native integrations work better.

Coverage depth. Web-only tools create blind spots for teams testing mobile apps or API endpoints. Platforms that unify web, mobile, and API testing under one interface reduce the number of tools you’re managing.

Debugging experience. Most automation effort goes into maintaining and fixing tests, not creating them. BrowserStack weights debugging and maintenance at 20% of their evaluation score — the same as ease of use — because a tool that can’t explain why a test failed leaves your team without a path forward.

Entry cost and free tiers. BugBug, Ghost Inspector, Katalon, and testRigor all have free plans that are genuinely useful for evaluation. Enterprise platforms — Tosca, ACCELQ, Mabl — are custom-quoted. Budget one to two days of hands-on trial per tool. The trial will tell you more than the feature page.


The Scripting Languages No-Code Tools Replace

Four scripting languages dominate test automation today: Python, TypeScript (and its JavaScript substrate), Groovy, and Ruby. Every no-code testing platform you evaluate either replaces what these languages do for non-engineering team members, wraps them under a visual interface, or exposes them as escape hatches for edge cases. Understanding that relationship is what lets a QA lead make a realistic adoption decision.

Python and TypeScript: What a Login Test Actually Looks Like

Here is a standard Python + Playwright login test — the kind your automation engineer writes and maintains:

python

# Python + Playwright: login test
from playwright.sync_api import sync_playwright, expect

def test_user_login():
    with sync_playwright() as pw:
        browser = pw.chromium.launch(headless=True)
        page = browser.new_page()
        page.goto("https://app.example.com/login")
        page.get_by_label("Email").fill("[email protected]")
        page.get_by_label("Password").fill("securepass123")
        page.get_by_role("button", name="Sign in").click()
        expect(page).to_have_url("https://app.example.com/dashboard")
        expect(page.get_by_text("Welcome back")).to_be_visible()
        browser.close()

Here is the testRigor equivalent — what a QA lead without a Python background writes instead:

go to "https://app.example.com/login"
enter "[email protected]" into "Email"
enter "securepass123" into "Password"
click "Sign in"
check that current url is "https://app.example.com/dashboard"
check that page contains "Welcome back"

Both tests verify the same user flow. The Python version gives your engineer full control over execution and debugging; the testRigor version gives your entire QA team authorship. Neither is objectively better — the question is who on your team will write and maintain these tests six months from now.

The Brittleness Problem: Why TypeScript Selectors Break

The typical TypeScript/Playwright test uses CSS class selectors. That works reliably until a front-end developer renames a class during a UI refresh:

typescript

// TypeScript + Playwright: brittle CSS selector
test('checkout button works', async ({ page }) => {
  await page.goto('/cart');
  await page.click('.btn-checkout');          // ← breaks if class renames
  await expect(page.locator('#order-confirm')).toBeVisible();
});

When .btn-checkout becomes .checkout-cta, every test using that selector fails. Your engineer opens each one and updates the locator. This is the maintenance problem Rukmangada Kandyala of Testsigma described on the TestGuild Automation Podcast (Episode 391): teams building custom Playwright suites often find themselves spending 40% of their time on maintenance rather than on new test coverage.

Self-healing no-code tools address this at the architecture level. They store multiple locator strategies per element — CSS class, visible text, ARIA role, visual position — and fall back through the chain when one fails. The test doesn’t break; a maintenance alert is generated.

Groovy in Katalon: The Scripting Escape Hatch

Katalon’s visual recorder generates Groovy code automatically. When a complex scenario needs scripted logic — a conditional assertion, a custom data loop, a third-party API call — Katalon translates visual steps into Groovy that a developer can extend:

groovy

// Katalon Studio: Groovy script view
import com.kms.katalon.core.webui.keyword.WebUiBuiltInKeywords as WebUI

WebUI.openBrowser('')
WebUI.navigateToUrl('https://app.example.com/login')
WebUI.setText(findTestObject('Page_Login/input_Email'), '[email protected]')
WebUI.setText(findTestObject('Page_Login/input_Password'), 'securepass123')
WebUI.click(findTestObject('Page_Login/button_SignIn'))
WebUI.verifyElementPresent(
    findTestObject('Page_Dashboard/div_Welcome'), 5)
WebUI.closeBrowser()

Groovy is JVM-based, with a syntax that sits between Java and Python. A non-developer doesn’t write it from scratch — but can read generated Groovy code, spot what changed, and edit string values without understanding the full API. That’s the design intention.

JavaScript Escape Hatches in BugBug and Mabl

Both BugBug and Mabl let you inject custom JavaScript steps when the visual interface can’t capture what you need — a dropdown that requires a hover event, a shadow DOM component inaccessible via standard selectors, a dynamic animation that blocks a click:

javascript

// BugBug / Mabl: custom JavaScript escape hatch step
const dropdown = document.querySelector('[data-testid="nav-dropdown"]');
dropdown.dispatchEvent(new MouseEvent('mouseenter', { bubbles: true }));
const items = document.querySelectorAll('.dropdown-item');
return items.length > 0;

This isn’t no-code — it’s a deliberately scoped code escape within a no-code workflow. Tools that offer a JavaScript escape hatch are better long-term bets than platforms that wall you in completely. You get the visual interface for the 80% of standard scenarios and JavaScript access for the 20% that need it.

One clean rule: if your team already writes Python or TypeScript, no-code tools add coverage surface area for non-engineers without replacing the scripted layer. If your team has no automation engineers, no-code tools are the starting point, and the JavaScript escape hatch is your growth path.


The Best No-Code Automation Testing Tools in 2026

The automation testing market reached $40.44 billion in 2026, with no sign of slowing — projected at $78.94 billion by 2031. The platform count has grown to match. These ten tools represent the most useful options across the full spectrum of team sizes and use cases.

Katalon Platform — The Balanced All-Rounder

Katalon offers visual recording, cross-browser execution via TestCloud, and a plugin ecosystem that covers Jira, Jenkins, GitHub Actions, and Azure DevOps. Web, mobile, and API testing all live in the same interface. A meaningful free tier makes evaluation accessible without a procurement conversation.

Best for: Mixed-skill teams of 5–50 engineers who want broad platform coverage without committing fully to either codeless or scripted automation. You can start recording tests with no code and add scripting only where complexity demands it.

The catch: Advanced scenarios push users into the scripting layer. For teams that need zero code across all test types, Katalon’s codeless mode has real limits.


Tricentis Tosca — The Enterprise Process Testing Powerhouse

Tosca uses Model-Based Test Automation: instead of scripting against UI selectors, you model your application’s business processes. When the app changes, you update the model once, and all related test cases update automatically. For large, heterogeneous landscapes — SAP, Salesforce, Oracle, mainframe systems — this is the most durable architecture available.

Best for: Large enterprises running packaged business software. Tosca’s Vision AI capability tests virtualized desktops and complex ERP interfaces that web automation frameworks can’t reach. If your organization is already building on no-code enterprise platforms, this guide to no-code enterprise application development explains the broader context.

The catch: Significant onboarding investment, steep learning curve, and enterprise licensing. Not the right starting point for a ten-person product team.


ACCELQ — The Business-Logic-First Choice

ACCELQ is fully codeless across web, API, mobile, and desktop. Its AI analyses business flows rather than just UI selectors and generates test scenarios that map to business outcomes. For a financial services team validating a loan origination workflow, that distinction matters: you’re verifying business logic, not just button clicks.

Best for: Regulated industries — financial services, insurance, healthcare — where test value is measured in business risk coverage, not code coverage.

The catch: Newer than Tosca, with less enterprise deployment history. Pricing is enterprise-only with no public tiers.


testRigor — Plain English for Non-Technical Testers

testRigor lets testers write steps the same way they’d write instructions for a human. No CSS selectors, no XPath, no element IDs — elements are identified by the visible text on screen. Machine learning handles the mapping from natural language to browser actions.

Best for: Manual QA testers, product managers, and business analysts who need to contribute to automation without developer support. testRigor has the lowest technical barrier on this list.

The catch: Ambiguity is the enemy. Debugging requires understanding what the AI interpreted, which is less clear than reading code. Teams with technical QA leads may find the lack of explicitness frustrating.


Mabl — The DevOps-Native Low-Code Platform

Mabl is built for teams where QA is embedded in the development cycle, not bolted on afterward. Its ML-based auto-healing, built-in analytics, and native integrations with GitHub Actions, GitLab CI, and Azure DevOps make it one of the cleaner options for engineering-led organizations. JavaScript snippets are available when the visual editor reaches its limit.

Best for: DevOps and QA teams of 10–50 engineers running continuous deployment pipelines. Mabl’s reporting layer gives engineering leads visibility into test health over time.

The catch: Paid-only, custom enterprise pricing. Can be overkill for a team maintaining a small, stable web app.


BugBug — Fastest Entry for Small Teams

BugBug is a browser-based recorder for Chrome. No infrastructure to provision, no complex setup — install the extension, start recording. A generous free plan is available. Custom JavaScript is available for edge cases the recorder can’t capture.

Best for: Startups and early-stage product teams that need web coverage fast without spending engineering time on framework decisions. BugBug is the right entry point when your team has no QA engineer and your app runs in Chrome.

The catch: Chrome and Chromium only. Firefox, Safari, and all mobile testing are out of scope. The moment cross-browser coverage becomes a requirement, you’ll outgrow BugBug.


Testsigma — The Cloud-First Comprehensive Platform

Testsigma uses NLP-based test authoring backed by AI test generation, running against a real cloud browser and device infrastructure. Web, mobile, and API testing live in a single interface. GenAI adoption in test creation now exceeds 70% of enterprise QA pipelines, and Testsigma’s architecture is built for that environment.

Best for: Cloud-first teams and mid-market companies (10–50 engineers) that need broad coverage across web and mobile without managing a physical device lab.

The catch: Onboarding requires structure. Teams that skip implementation best practices produce fragile test suites. Free trial is limited.


Ghost Inspector — The Instant Smoke-Test Tool

Ghost Inspector is built for one specific job: scheduled smoke tests on critical user flows. Install the Chrome extension, record a test, and Ghost Inspector runs it on a cloud schedule. API triggers handle CI/CD. Setup takes minutes.

Best for: Solo developers and small teams that need login, checkout, or sign-up flows verified automatically without any testing infrastructure investment.

The catch: Basic record-and-playback with limited resilience to UI changes. Ghost Inspector is closer to a monitoring tool than a comprehensive testing platform. Valuable for what it does; bounded by design.


Leapwork — Visual Flowchart Testing for Business Users

Leapwork replaces code with flowchart blocks. Test logic is visible to all stakeholders as diagrams — no code to read, no selectors to understand. For regulated industries where QA traceability is an audit requirement, that transparency has real value.

Best for: Non-technical enterprise QA teams and business users who need to own test creation without engineering dependency.

The catch: Complex scenarios become flowchart spaghetti. Scaling past a few hundred tests creates its own maintenance overhead, just in a visual format instead of a scripted one.


KaneAI (TestMu AI) — The GenAI-Native Testing Agent

KaneAI is the only tool on this list built specifically for testing AI-powered applications. GenAI-native platforms like KaneAI support AI agent testing — validating chatbots, voicebots, and LLM-integrated interfaces — a category traditional codeless tools can’t address. Tests are authored in plain English through GPT-4 and Claude integrations, executed against LambdaTest’s real-device cloud.

Best for: Enterprises and product teams building or testing AI-powered products. If you need to verify that a customer service chatbot handles varied inputs correctly, KaneAI is currently the only no-code option with native support for that test type. For teams exploring AI agents more broadly, our roundup of the best low-code AI agents covers the adjacent tooling landscape.

The catch: AI-native edge cases can produce unexpected behavior. The platform is still maturing relative to tools with decade-long enterprise deployment histories.


How to Set Up Your First No-Code Testing Project?

As Frank DeGeorge, CTO at Impact Networking, put it: “The purpose of automated testing is to reduce the risk of failure of your application.” That framing matters before you set up your first test. The goal isn’t to automate everything — it’s to reduce the specific risks that cost your team the most.

Step 1: Audit your application’s surface area. Write down what you’re actually testing before you open a browser extension. Is it web only? Web and mobile? Does it have a public API to verify? Does it touch a desktop app? This audit determines which tools belong on your shortlist — BugBug and Ghost Inspector are web-only; Testsigma and Katalon cover web, mobile, and API from a single interface.

Step 2: Identify your three highest-risk flows. These are the user journeys that, if broken, customers notice immediately. Login, checkout, core feature activation. Start there. Resist building 50 tests before one is stable. A suite of 10 reliable tests is more valuable than 80 flaky ones.

Step 3: Select a tool using the team size guide. The “How to Choose” section below maps team size to platform. The short version: BugBug for solo web teams; testRigor or Testsigma for growing teams with non-technical contributors; Mabl or Katalon for DevOps-embedded QA at scale.

Step 4: Install and authenticate. Extension-based tools (BugBug, Ghost Inspector, testRigor) are live in under 10 minutes — install from the Chrome Web Store, create an account, and you’re recording. Cloud-native tools (Mabl, Testsigma, ACCELQ) require email sign-up, an organization setup, and sometimes an API token for your CI/CD connection. Budget 30 minutes.

Step 5: Configure your staging environment. Point the tool at your staging URL, not production. Set environment-specific credentials as variables rather than hardcoding them in test steps — this is the difference between a test suite that works in CI and one that breaks on every deploy.

Step 6: Create your first test project folder. Name it by feature or user journey, not by date. “Authentication Tests” and “Checkout Flow Tests” are folder names you’ll still understand in six months. “Tests – June 2026” is not.


How to Write Your First Test Without Scripting?

testRigor is the clearest tool for explaining no-code test authoring because its input format — plain English sentences — exposes the logic directly. The same mental model applies to every platform: you’re describing user behavior in sequential steps, each ending in either an action or an assertion. The syntax changes; the logic doesn’t.

Here is a complete login test in testRigor plain English:

go to "https://app.example.com/login"
enter "[email protected]" into "Email"
enter "securepass123" into "Password"
click "Sign in"
check that current url is "https://app.example.com/dashboard"
check that page contains "Welcome back, QA User"

Six lines. Two assertions (URL and page text). This test would be 15–20 lines in Python/Playwright and require locators, async handling, and assertion imports. In testRigor, a manual QA tester without any automation background writes it in five minutes.

Here is a more complex checkout flow: two items added, a coupon applied, order confirmed:

go to "https://app.example.com/products"
click "Add to cart" near "Pro Plan Monthly"
click "Add to cart" near "Annual Billing Add-on"
go to "https://app.example.com/cart"
enter "SAVE20" into "Coupon code"
click "Apply coupon"
check that page contains "Coupon applied"
check that page contains "$80.00"
click "Proceed to checkout"
check that current url contains "/checkout"

The near keyword scopes a click to text adjacent to a specific label — it handles multiple “Add to cart” buttons on the same page without CSS selectors or XPath.

The same logic applies in every platform. In Mabl, you click through this flow in a visual editor and the tool records equivalent steps. In Katalon’s visual mode, keyword actions follow the same sequential structure. The format changes; the test is the same test.

When a test fails on assertion timing: The most common first-run failure is an assertion checking for text that appears after a brief delay. Add a wait step before the assertion: wait 3 seconds in testRigor; configure smart-wait in Mabl or Katalon. Most modern platforms handle this automatically. If a test fails intermittently on assertion timing, that’s the fix.


How to Connect Your Tests to GitHub Actions?

According to ThinkSys 2026 data, 89.1% of QA teams now run CI/CD pipelines. Tests that only run manually deliver half the value of tests that trigger on every pull request. Connecting your no-code suite to GitHub Actions is typically a one-hour setup.

Native Integrations vs. API Triggers

Native integrations (Mabl, Katalon, Testsigma, ACCELQ, Tricentis Tosca) provide a dedicated GitHub Actions connector. You install their official action, pass an API token, and the test suite runs as a step in your workflow. These are the cleanest integrations and the least likely to break when GitHub Actions updates.

API triggers (testRigor, Ghost Inspector) use curl commands or webhook calls. They work in any CI/CD system but require more configuration:

yaml

# .github/workflows/e2e-tests.yml
name: E2E Test Suite
on:
  push:
    branches: [main, develop]
  pull_request:
    branches: [main]

jobs:
  run-tests:
    runs-on: ubuntu-latest
    steps:
      - name: Trigger testRigor suite
        run: |
          curl --silent --fail -X POST \
            "https://api.testrigor.com/api/v1/apps/${{ secrets.TESTRIGOR_APP_ID }}/retest" \
            -H "auth-token: ${{ secrets.TESTRIGOR_TOKEN }}" \
            -H "Content-Type: application/json" \
            -d '{"branch": "${{ github.ref_name }}"}'

For Mabl, the native action looks like this:

yaml

      - name: Run Mabl tests
        uses: mablhq/github-run-tests-action@v1
        env:
          MABL_API_KEY: ${{ secrets.MABL_API_KEY }}
          MABL_ENVIRONMENT_ID: ${{ secrets.MABL_ENVIRONMENT_ID }}

Both run as steps inside your existing build job.

The Most Common CI Failure

A test recorded against https://app.example.com (production) runs in CI against https://staging.example.com — and the staging environment is missing a product, has a different login flow, or returns different response text. The test fails; the team blames the tool.

Fix: store your target URL as a CI/CD secret and inject it into the test runner’s environment configuration, not hardcoded in individual test steps. Every major platform supports environment variables for exactly this reason.


How to Debug a Failing No-Code Test?

Most automation time is spent maintaining and fixing tests, not writing them. Understanding the four failure categories saves hours when a CI run turns red.

Element Not Found

The tool tried to interact with an element it couldn’t locate. What it means per mechanism:

  • Record-and-playback (BugBug, Ghost Inspector): A CSS class, element ID, or DOM position changed. Re-record the affected step or update the selector manually in the test editor.
  • NLP / plain-English (testRigor): The visible text the step references changed. Update the step to match the new label. If the label no longer exists, the underlying feature changed — verify with the dev team.
  • Self-healing platforms (Mabl, Testsigma, ACCELQ): Check the heal log — it shows which locator strategies were tried and which succeeded. If none worked, the element’s entire identity changed. Re-record or re-author the step.

Assertion Failed

The test found the element but the expected condition wasn’t met. This is almost always an application bug — the test is doing its job. Before debugging the test, verify whether the behavior being tested actually works correctly in your staging environment. A failed assertion that doesn’t correspond to a real bug is a test design problem, not a tool problem.

Timeout

The element never appeared within the tool’s default wait window (typically 10–30 seconds). Cause: async page loading, slow API response, or a network condition in the CI environment. Fix: increase the timeout threshold for that specific step, or add an explicit wait before the action. In testRigor: wait 5 seconds. In Mabl and Katalon: configure the global or per-step timeout in your test settings.

Environment Error

The test ran against wrong credentials, a wrong URL, or a data state that wasn’t set up correctly. Symptoms: passes locally, fails in CI; the first step succeeds but subsequent steps fail because expected data doesn’t exist. Fix: isolate each test from shared state. Set up the required data independently per test rather than relying on a previous test to create it.

Screenshots and step-level video recordings are the debug toolkit. Before building a suite larger than 20 tests, confirm your tool produces both on failure. A test suite that can’t explain why it failed is harder to maintain than a manually-run spreadsheet.


How to Choose: Matching Tools to Your Team Size and Stack

The question is never which tool is objectively best. It’s which tool fits your team right now, with room to grow into.

Startups and solo QA (1–5 people): Start with BugBug or Ghost Inspector. Low cost, fast setup, Chrome-first web coverage. Don’t invest in a 50-person-team platform before your product and testing requirements have stabilized.

Growing product teams (5–20 people, no dedicated SDET): testRigor or Testsigma. testRigor’s plain-English authoring means any team member can contribute to test coverage; Testsigma adds mobile when the product expands beyond web.

Mid-market DevOps teams (10–50 engineers): Mabl or Katalon. CI/CD integration matters at this scale, and both platforms are built around it. Katalon’s free tier lets you evaluate before spending; Mabl’s analytics layer adds value as your suite grows.

Enterprise (50+ engineers, complex tech stacks): Tricentis Tosca for SAP, ERP, and mainframe environments; ACCELQ for business-logic-heavy regulated verticals; KaneAI for organizations building AI-powered products.

A secondary factor: your application’s rate of UI change. High-churn UIs need strong self-healing — testRigor, Mabl, and Tosca handle this well. Stable internal tools work fine with lighter options. If you’re still weighing whether low-code platforms fit your organization’s maturity, this guide on when to use a low-code platform offers a useful decision framework.

About 42% of smaller firms cite budget constraints as the primary obstacle to automated testing adoption. For those teams: BugBug, Katalon, Ghost Inspector, and testRigor all offer meaningful free tiers. Start there. Buy up when the limits become visible.


Where No-Code Testing Hits Its Ceiling?

Codeless testing tools are not a complete replacement for code-based approaches. The ceiling is real, and knowing it before you choose matters.

The 80–90% rule holds: codeless tools reliably handle the standard majority of test scenarios. What falls outside that range: complex business logic with multi-step conditions; performance testing at load; desktop application testing beyond packaged enterprise tools; and testing AI-generated outputs where pass/fail assertions don’t apply.

There’s also the automation debt problem. Over 60% of enterprise QA pipelines run automation, but teams that automate without architectural discipline accumulate excessive test cases, fragile selectors, and false confidence in coverage. No-code tools accelerate that accumulation because authoring is faster than thinking through what’s worth testing. For practical examples of how no-code and low-code platforms are deployed at scale, our examples of low-code/no-code platforms in practice offers relevant context.

The mitigation: use codeless tools for the standard 80%, then add a coded layer for the complex 20%. Tools that offer a JavaScript or Python escape hatch — Mabl, Katalon, BugBug — are better long-term bets than platforms that wall you in completely.

QA professionals are evolving from script writers to test strategists. The value is no longer in authoring scripts manually — it’s in knowing what to test, when to test it, and how to interpret failures. No-code tools free QA leads from repetitive scripting. That freedom is only useful if someone steps into the strategic space it creates.


No-Code Testing Technical Reference

Authoring and Execution

Codeless automation — Building automated tests without writing test scripts. The tool handles the underlying code layer; the tester defines what to verify through a visual or natural-language interface. Codeless and no-code are used interchangeably across the industry.

Test script — A file containing step-by-step instructions a testing framework executes. In scripted automation (Python, TypeScript, Groovy), this is code. In no-code tools, the visual or plain-English step sequence is the functional equivalent.

Test case — A single test scenario covering one expected behaviour. “User can log in with valid credentials” is a test case. A well-scoped test case covers exactly one thing and has a clear pass/fail condition.

Test suite — A collection of related test cases run together as a group. Organized by feature area (Authentication Suite, Checkout Suite) or by risk level (Smoke Tests, Full Regression).

Test runner — The engine that finds test files, executes them, and outputs pass/fail results. Playwright, pytest, and JUnit are test runners in scripted automation; no-code platforms build the runner into their interface.

Headless browser — A browser that runs without a visible user interface, used in CI/CD environments where no display is available. Faster than headed mode; harder to debug without a visible page.

Headed mode — Browser testing with a visible interface, used for recording, manual debugging, and step-by-step verification. All browser-based no-code recording tools require headed mode during test authoring.

Locators and Selectors

CSS selector — A pattern that identifies HTML elements by class, ID, or attribute. Examples: .btn-submit (class), #email-field (ID), [data-testid="submit"] (attribute). CSS selectors are fast and precise; they break when class names or IDs change.

XPath — An XML-based query syntax for locating elements by their position in the DOM hierarchy. Example: //div[@class='modal']//button[text()='Confirm']. More flexible than CSS selectors; slower to execute and harder to maintain.

Locator strategy — The method a testing tool uses to find an element. Modern tools try multiple strategies in sequence: ARIA role → visible text → CSS attribute → visual fingerprint. The fallback hierarchy determines test resilience.

DOM (Document Object Model) — The tree structure representing a web page’s HTML. Testing tools navigate and interact with the DOM to perform actions and verify state. A DOM change — a renamed class, a moved element — is the most common cause of test failure.

Shadow DOM — Encapsulated component DOM trees used by web components, not accessible via standard CSS selectors. Shadow DOM elements require special handling in most testing tools, often pushing tests into JavaScript escape-hatch territory.

Stability and Maintenance

Self-healing locator — A mechanism that stores multiple locator strategies per element and falls back through the chain when the primary locator fails. When an element is found through an alternate strategy, the locator updates automatically. Enterprises adopting self-healing report 25–50% reductions in test maintenance costs.

Flaky test — A test that passes and fails intermittently without any change to the application under test. Usually caused by unstable CSS selectors, race conditions in async page loading, or inconsistent test environment state. Industry target: keep flakiness rate below 2% of test runs.

Test flakiness rate — The percentage of test runs that produce inconsistent results for the same code and environment. A rate above 5% signals architectural problems in the suite, not just individual bad tests. Most no-code platforms display this metric in their dashboards.

Test Design

Assertion — A statement that verifies an expected condition. Common types: URL matches expected value; element contains expected text; element is visible; count of elements matches expected number; API response returns expected status code.

Test fixture — A preconfigured state required before a test runs. Examples: a logged-in user session, a shopping cart with specific items, an API token with write permissions. Poorly managed fixtures cause tests to depend on each other — a primary source of suite fragility.

Test data — The input values used during execution. Can be hardcoded (simple, brittle), parameterized (flexible, reusable), or AI-generated (increasingly common in enterprise platforms like ACCELQ and Testsigma).

BDD (Behaviour-Driven Development) — A test design approach where scenarios follow a “Given / When / Then” structure from the user’s perspective. “Given the user is logged in, When they click Add to Cart, Then the cart count increments by 1.” testRigor and ACCELQ natively support BDD-style authoring.

Shift-left testing — Moving testing earlier in the development cycle so defects are caught before code reaches production. No-code tools support shift-left by enabling non-engineers to write tests during sprint planning rather than after development completes.

Integration and Reporting

Pipeline trigger — The event that starts an automated test run in CI/CD. Common triggers: git push to main, pull request opened, scheduled nightly cron, manual workflow dispatch. Configuring the right trigger separates tests that run sometimes from genuine continuous testing.

Visual regression — A test technique that detects pixel-level or layout changes in screenshots taken across builds. Applitools, Percy, and BrowserStack’s visual testing feature compare each run against a baseline and flag differences. Visual regression tests catch CSS regressions that functional tests miss.


Frequently Asked Questions

What is the difference between no-code and low-code test automation?

No-code test automation tools are designed for users with no programming background — visual recorders, plain English, and drag-and-drop flows only. Low-code tools allow non-developers to work visually but include optional coding layers for advanced scenarios. Katalon and Mabl sit in the low-code category; testRigor and BugBug are closer to true no-code. The practical difference is what your team does when a test scenario exceeds the visual editor’s capability.

Can no-code testing tools handle API and mobile testing, or just web UIs?

Several tools cover all three. Testsigma, ACCELQ, Katalon, and Tricentis Tosca all support web, mobile, and API testing from a single platform. BugBug and Ghost Inspector are web-only — Chrome-only in BugBug’s case. Before committing, map your application’s surface area against the tool’s actual coverage. Marketing pages list capabilities; free trials confirm them.

How does self-healing work in no-code test automation?

When a test runs against an element that has changed — a button’s CSS class, a form field’s ID, a layout restructure — a hard-coded selector fails. Self-healing tools use multiple strategies to find the same element: alternate attributes, visual similarity matching, and context from surrounding elements. When found through an alternate strategy, the locator updates automatically. Enterprises adopting self-healing report 25–50% reductions in automation maintenance costs. Tests continue running; a maintenance alert is generated for human review.

Which no-code testing tool is best for enterprise SAP or ERP environments?

Tricentis Tosca is the clearest choice for SAP, Oracle, and mainframe environments. Its Model-Based Test Automation architecture separates business process logic from technical selectors, and its Vision AI capability tests virtualized desktop interfaces that web frameworks can’t reach. ACCELQ is a strong secondary option for teams needing codeless coverage across web and API alongside packaged enterprise app testing.

Do no-code testing tools integrate with CI/CD pipelines like GitHub Actions or Jenkins?

Most do, though the quality of integration varies significantly. Mabl, Katalon, Testsigma, and Tricentis Tosca offer native integrations with GitHub Actions, GitLab CI, Azure DevOps, and Jenkins. Ghost Inspector and testRigor use API-based triggers — functional, but requiring more manual configuration. Before selecting, confirm that your specific pipeline is explicitly supported. “Works with any CI tool” often means a day of DevOps work to get it running correctly.